Airflow Monitoring and Alerting
Our Airflow project includes a monitoring system that combines Elasticsearch for centralized storage of error logs and Microsoft Teams notifications via Apprise for real time alerts.
This part was implemented to facilitate the identification of crawling system errors.
Instead of manually checking Airflow task logs, the system automatically sends notifications to a dedicated Teams channel whenever an error occurs during a crawl.
At the same time, all error details are stored in Elasticsearch, where we have a dashboard that provides a consolidated view of issues along with contextual information to help diagnose and resolve problems quickly
Error logs are generated automatically whenever a failure is detected during the crawling process. For each error, a structured document is created based on the event type and is sent simultaneously to both Elasticsearch and the Teams channel.
We have two primary event types:
| Event Type | Description | Index Example |
|---|---|---|
login_failed |
Driver or API login/authentication failed | airflow-domain-errors, airflow-social-media-errors |
job_failed |
Job level failure during execution | Same as above |
Document Structure in Elasticsearch
Each log document is structured as a JSON object
Login Failure
Document structure for domain part
- event_type: The category of the event (
login_failed) - platform: The driver name
- domain_identifier: Identifier of the domain
- message: Error Message
- timestamp: The exact time the event occurred
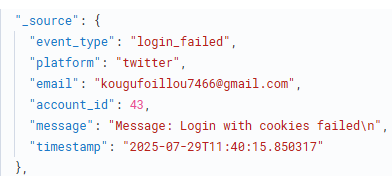
Document structure for social media part
- event_type: The category of the event (
login_failed) - platform: The driver name
- email: The account email used for the login attempt
- account_id: The ID of the account in dauthenticator
- message: Error Message
- timestamp: The exact time the event occurred
Example
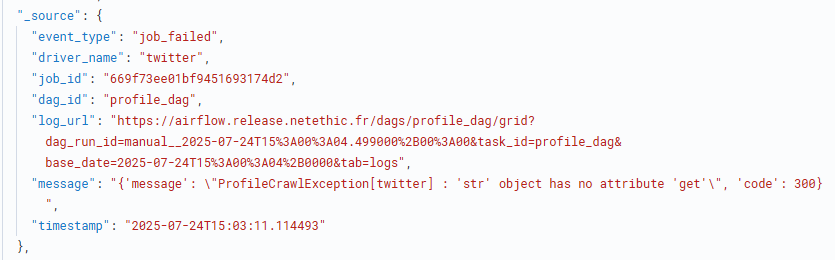
Job Failure
- event_type: The category of the event (
job_failed) - driver_name: The name of the driver
- job_id: Mongo ObjectId of the failed job
- dag_id: The Airflow DAG in which the failure occurred
- log_url: Direct link to the Airflow logs
- message: Error Message
- timestamp: The exact time the event occurred
Example
These documents are pushed to Elasticsearch using the log_to_elasticsearch function
Environment Configuration (.env)
To enable monitoring, configure your environment variables as follows:
# Elasticsearch
ELASTICSEARCH_URL=https://your-elasticsearch-server:port
ELASTICSEARCH_USERNAME=elastic
ELASTICSEARCH_PASSWORD=yourpassword

# Used in log_url to point to Airflow UI
AIRFLOW_URL=https://your-airflow-url
Make sure these are loaded in your environment before starting Airflow
Microsoft Teams Notifications via Apprise
Step 1: Create Teams Webhook
- Go to your Teams channel → Connectors → Incoming Webhook
- Name your webhook
- Copy the generated Webhook URL
For more details, you can check this document
Step 2: Create Airflow Connection
In the Airflow UI, create a new connection:
| Field | Value |
|---|---|
| Conn ID | teams_notification |
| Conn Type | HTTP |
| Extra JSON | { "url": "<WEBHOOK_URL>" } |
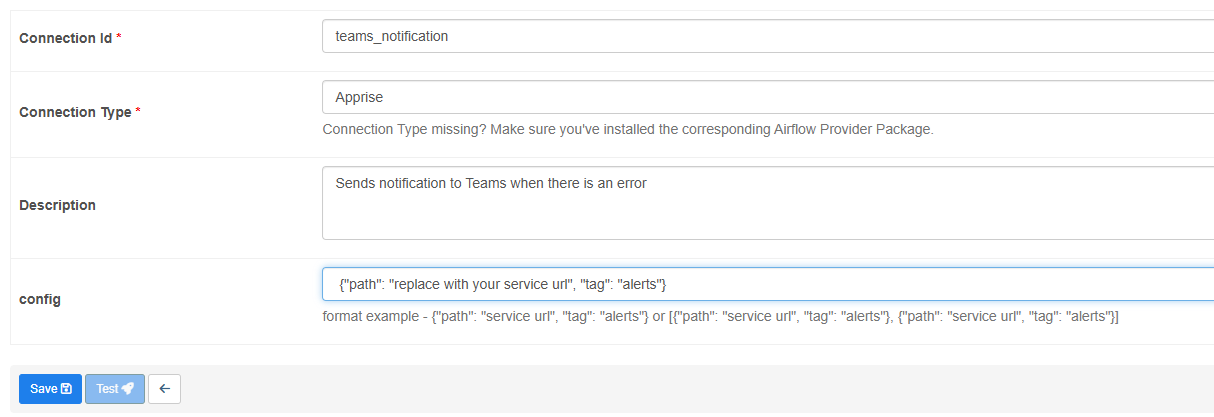
This connection will be used by the Apprise provider to send alerts
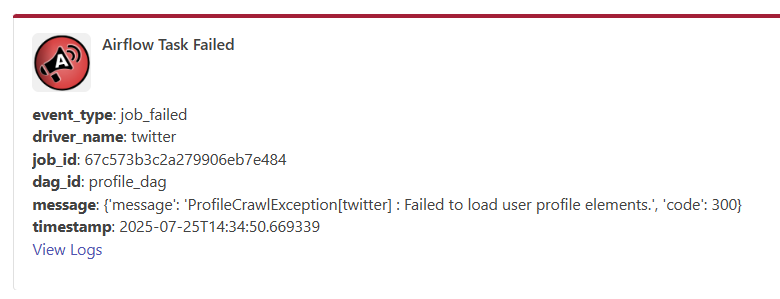
Teams Notification Content
Notifications sent to Teams summarize the failure with Markdown formatting:
- event_type: job_failed
- driver_name: driver_name
- job_id: job_id
- dag_id: dag_id
- message: error_message
- View Logs: opens log url
Example
Function Used
To centralize the logic for both logging and alerting we used the function send_logs_and_notifications:
def send_logs_and_notifications(doc: dict, index: str, context: dict, apprise_conn_id="teams_notification"):
    log_to_elasticsearch(index, doc)
    send_teams_notification(doc, context, apprise_conn_id)
This function is called from:
DomainDriverManager(login failures for domain part)DriverManage(login failures for social media part)_process_jobs()(failed jobs)
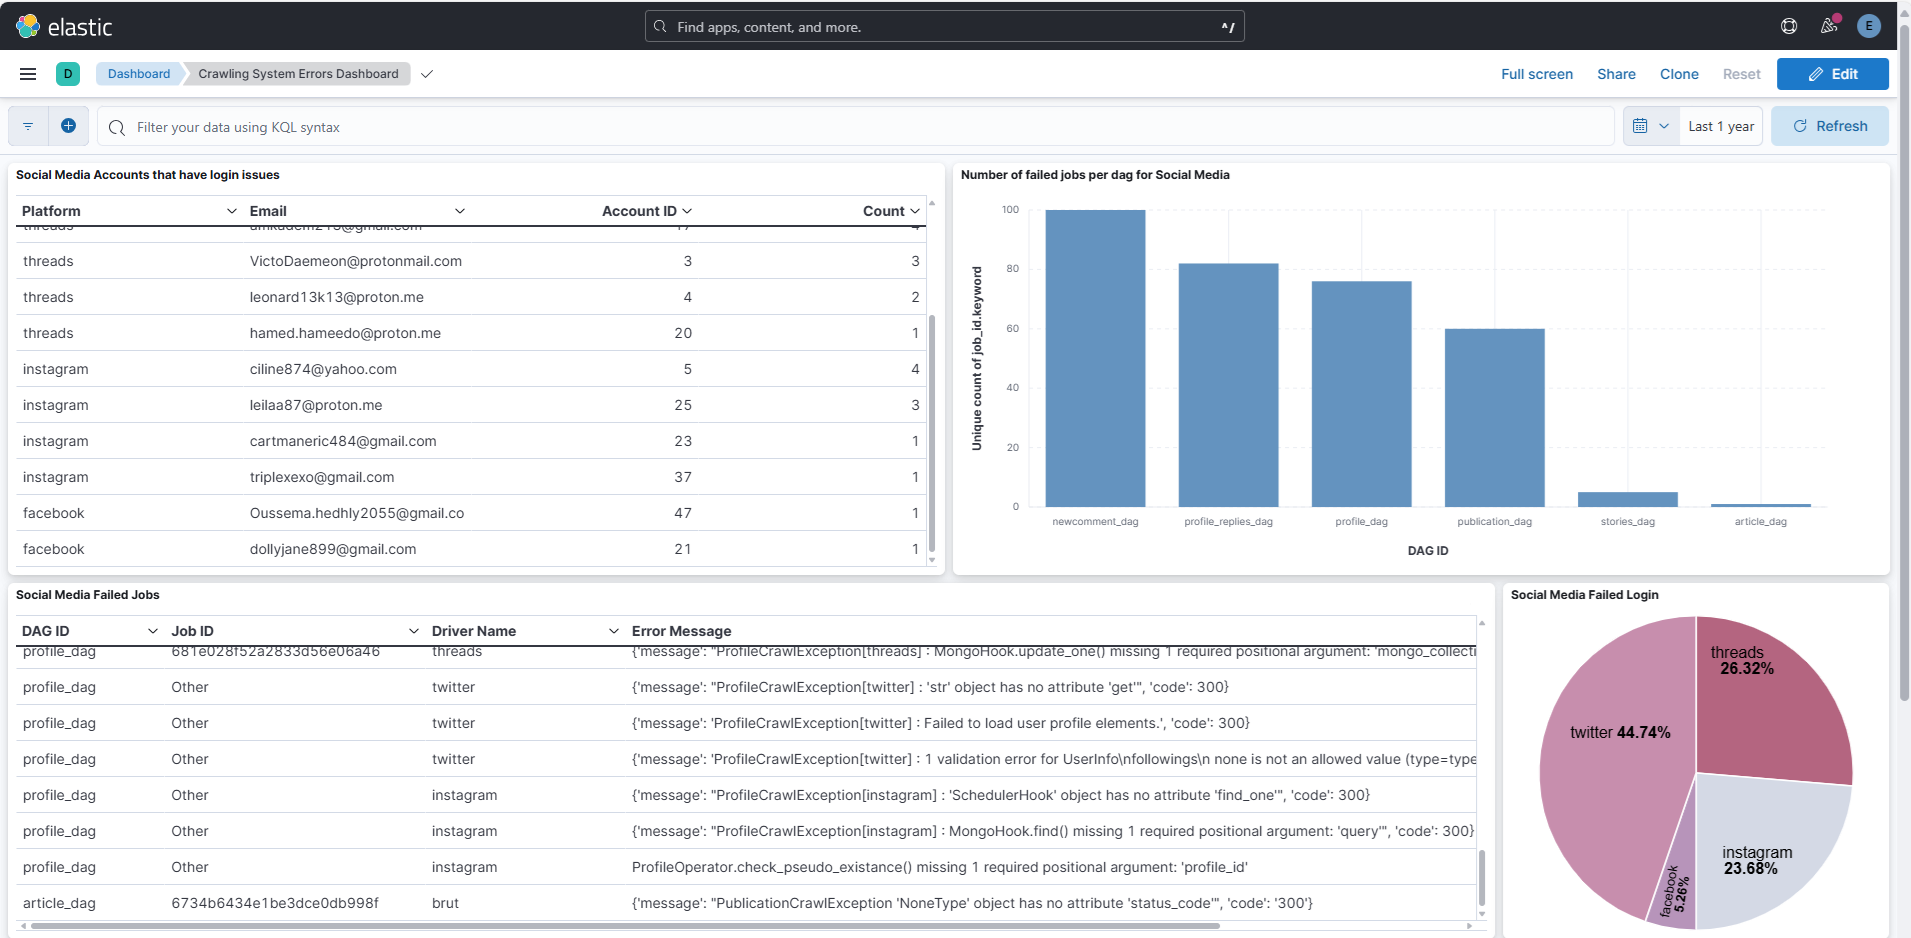
Dashboard
The dashboard is available here